January 2025 Charts
Three Charts That Have Our AttentionIf you are curious about what’s going on in the market or economy, we’d like to share some charts / graphics that we think are insightful.S&P 500 Revenues. There is a prevailing market narrative that the U.S. market outlook is strong, while Europe, the UK, and China face challenges.
Three Charts That Have Our Attention
If you are curious about what’s going on in the market or economy, we’d like to share some charts / graphics that we think are insightful.
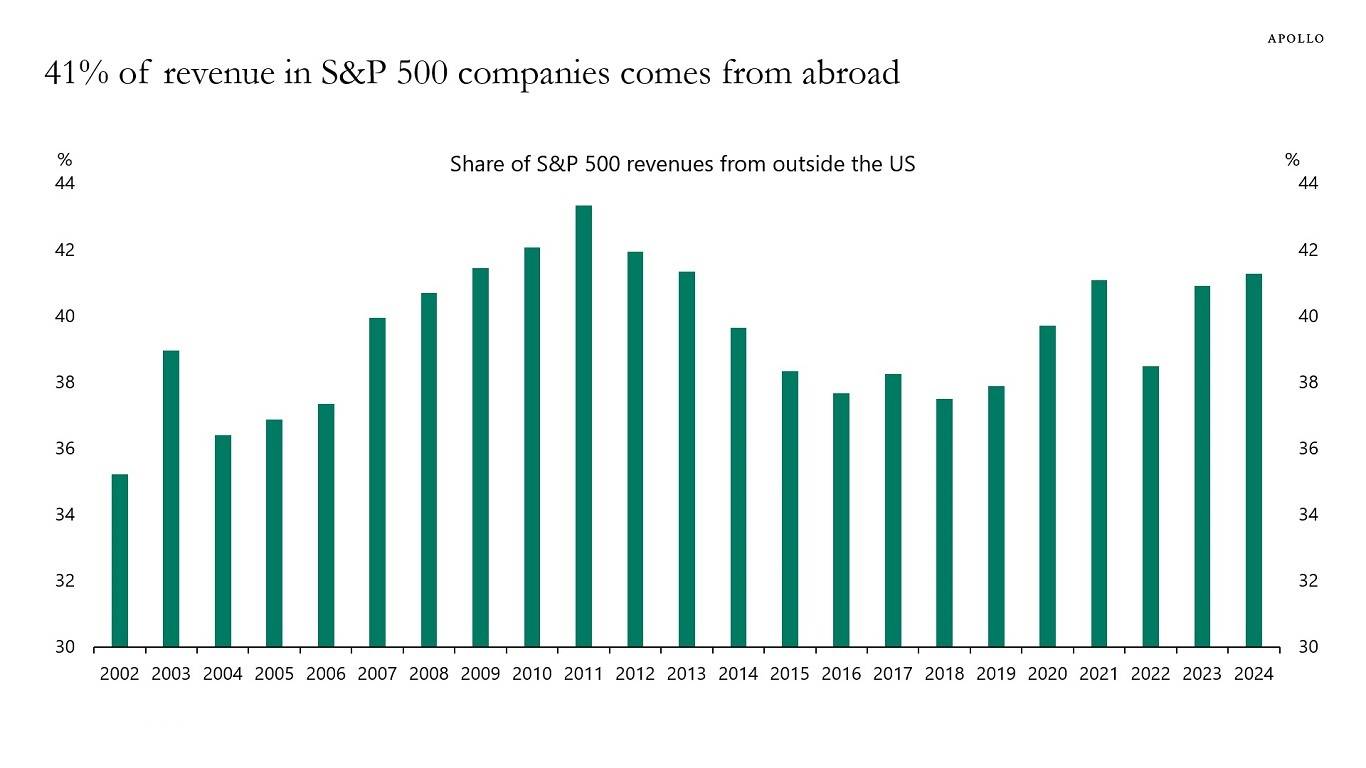
S&P 500 Revenues. There is a prevailing market narrative that the U.S. market outlook is strong, while Europe, the UK, and China face challenges. However, 41% of S&P 500 revenues come from abroad. A recession in Europe and a slowdown in China could cause harm, while strong international economic conditions would provide a favorable tailwind for S&P 500 earnings.
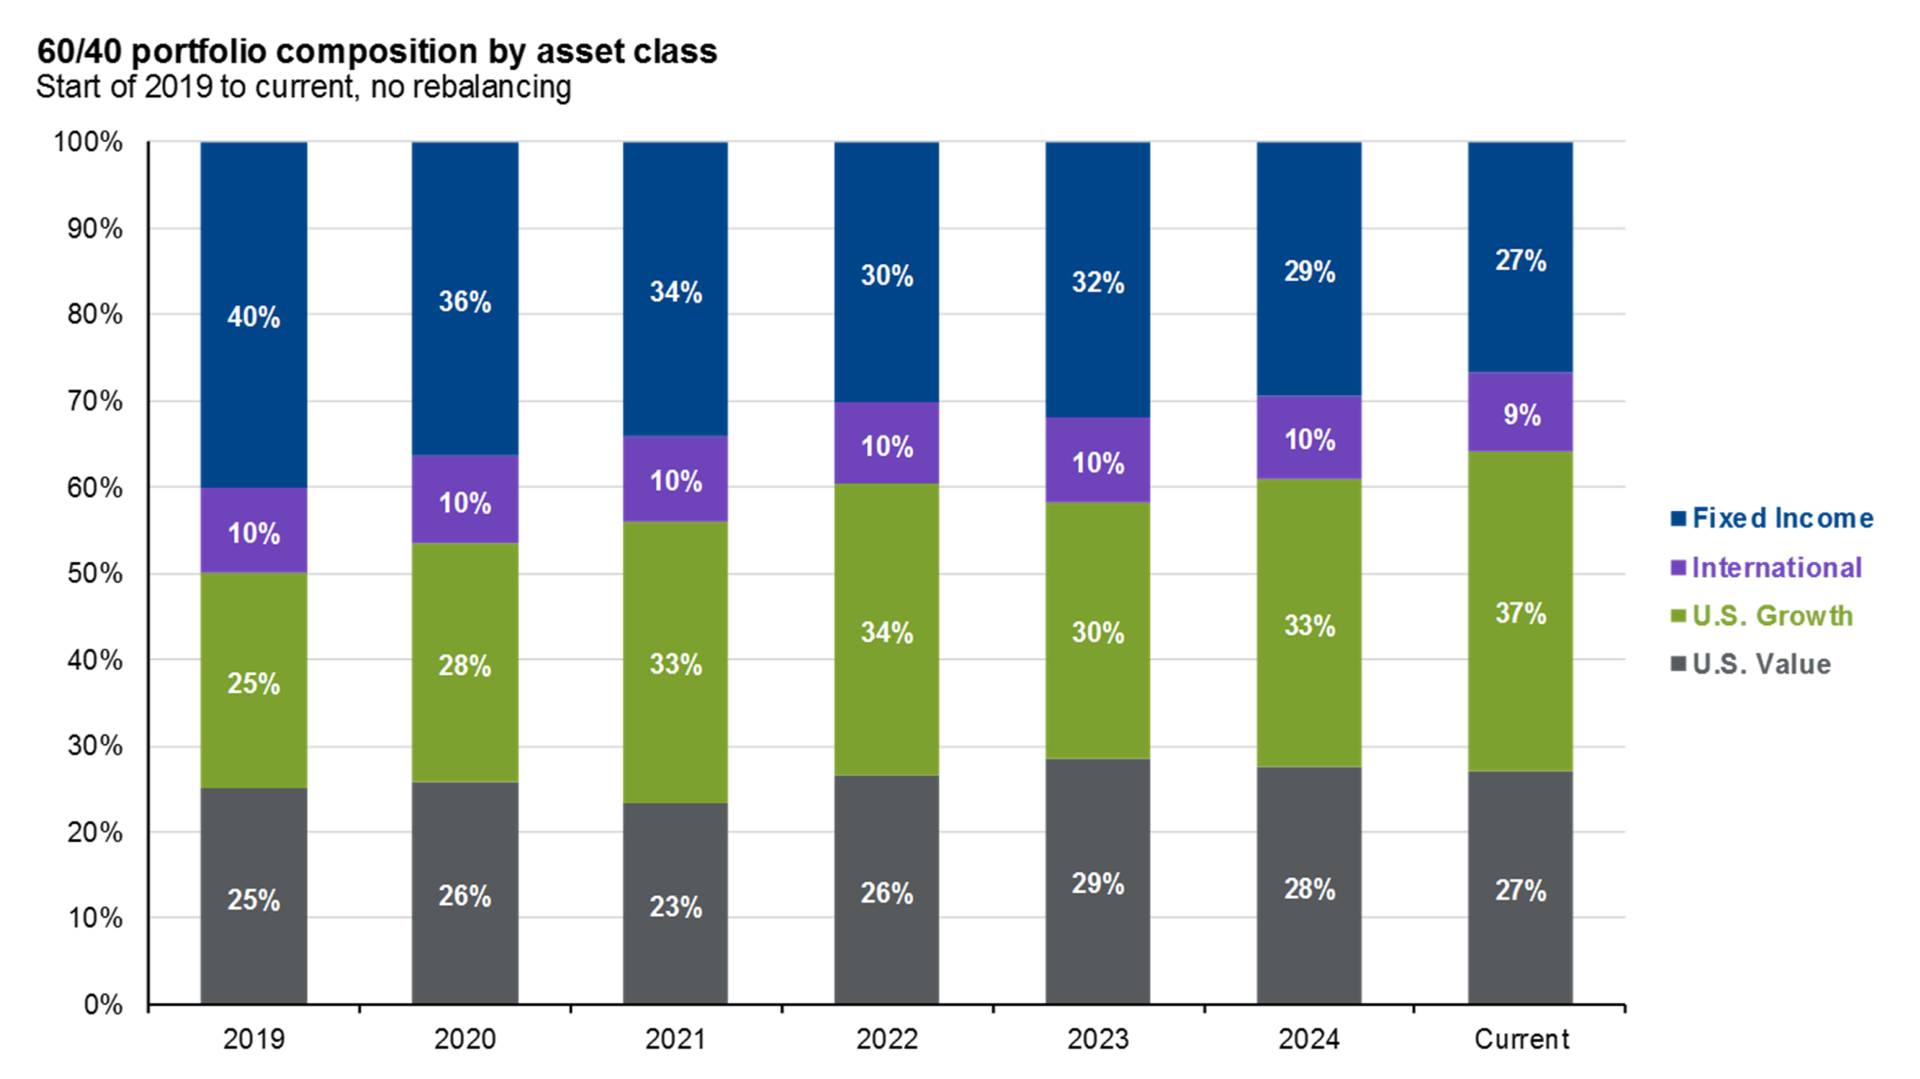
Portfolio Drift. The habit of rebalancing to prevent "portfolio drift" away from your target asset allocations is critical for maintaining appropriate market exposure. This chart shows how a 60/40 portfolio shifted from 2019 to the present without rebalancing, with fixed income decreasing from 40% to 27% and U.S. growth stocks rising from 25% to 37% due to strong performance. The portfolio has become more equity-heavy, driven by gains in U.S. growth stocks, while U.S. value and international stocks have remained relatively stable. Read our planning tip from earlier this month that talks more about rebalancing.
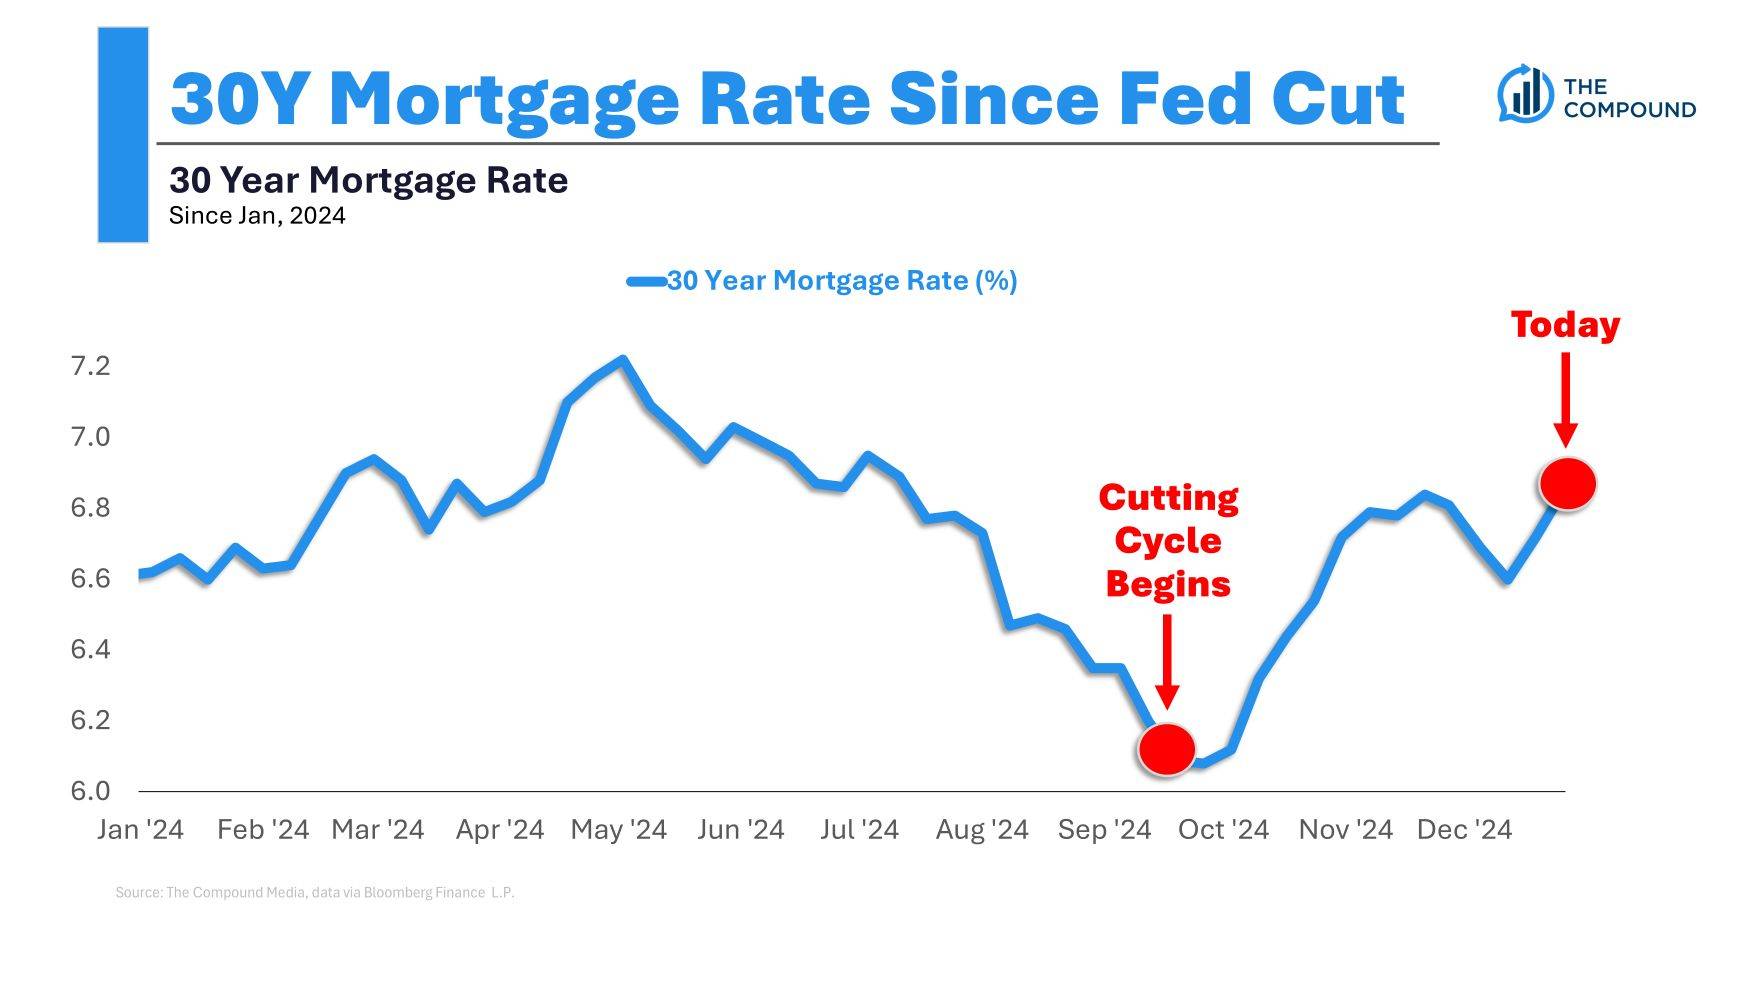
Fed Cut Cycle & Mortgage Rates. Despite the Fed's rate cuts, mortgage rates have not sustained lower levels, possibly due to other factors like economic resilience, inflation concerns, or shifts in market expectations. This highlights the complex relationship between Federal Reserve actions and broader financial conditions.
Whenever you're ready, we’re here to help you.
The benefits of working with a fee-only advisor are namely expertise, time, and objectivity. You can schedule a no-obligation call with us to learn how we work with you to simplify, organize, and clarify your financial life.


